Campus Monitoring & Visualization🔗
This section contains comprehensive monitoring and visualization capabilities for campus environments, with the exact content from the original monitoring sections reorganized for campus use.
Reports🔗
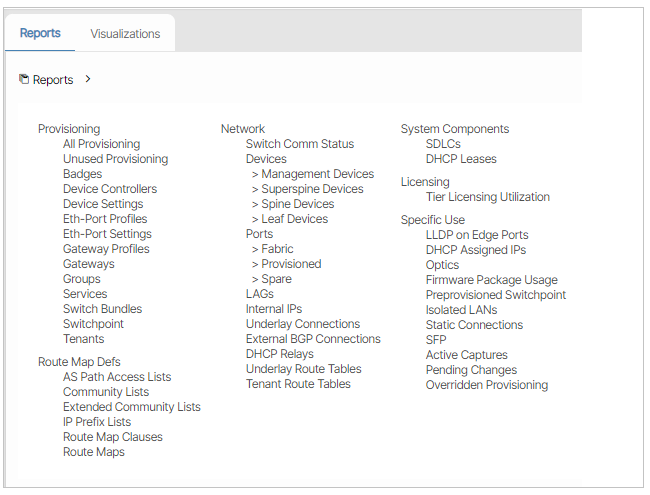
Reports are tabular views of provisioned objects and detected elements within the network. Reports can be easily filtered and customized to create individual operator-specific reporting on any element in Everon™ Network Solutions. Reports also support bulk actions applied to multiple selected objects.
Reports are accessed from the Main Menu Reports icon ( ).
).
In addition, throughout all the navigation panes, usually on the top right of each sub panel, the UI displays a report icon ( ).
).
Clicking on the report icon takes you to a text-based list that can be sorted, highlighted, exported to CSV, and navigated from. Also, certain bulk commands are supported from the reports. Those functions are launched by selecting rows in the report and clicking the icons at the top.
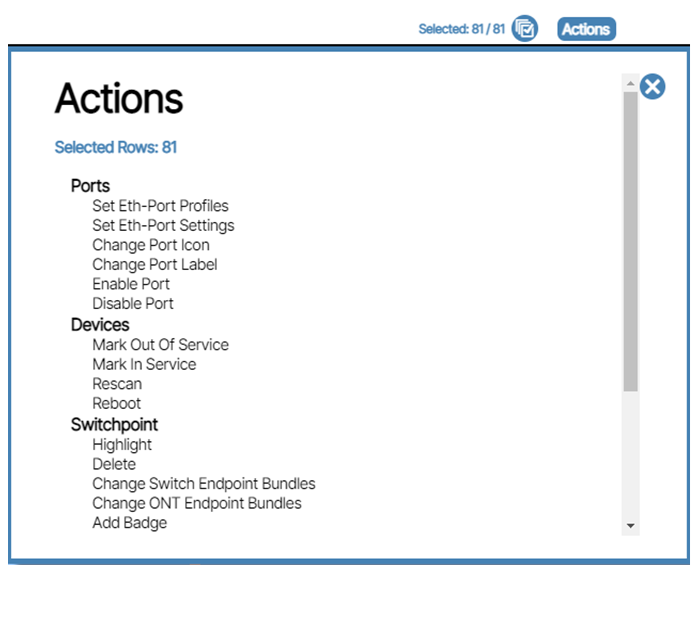
Applying Actions to Report Items🔗
To apply actions to Report items, you select the item(s) you want to affect, click the Actions button, and choose the desired action. All selected Report items are affected by the change.
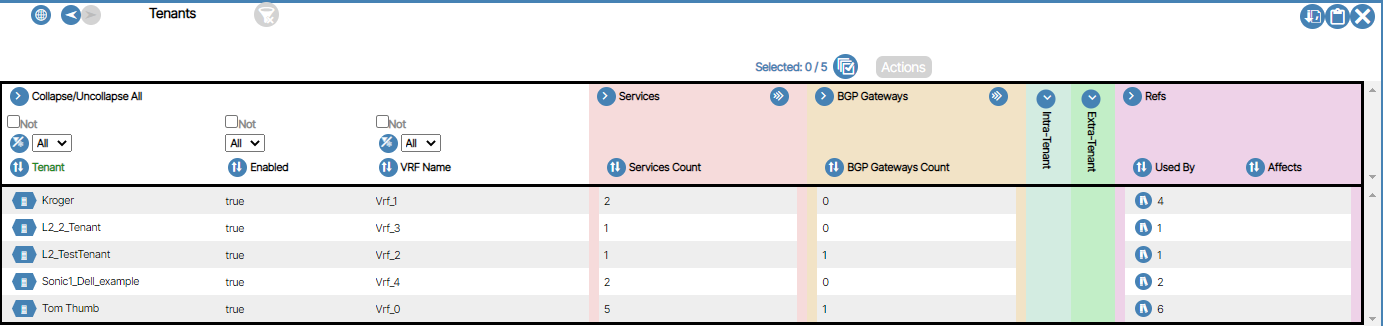
Report Filtering using Regex🔗
To apply actions to specific entries within Report, you select the item(s) you want to using simple drop down selections or regular expressions (regex).
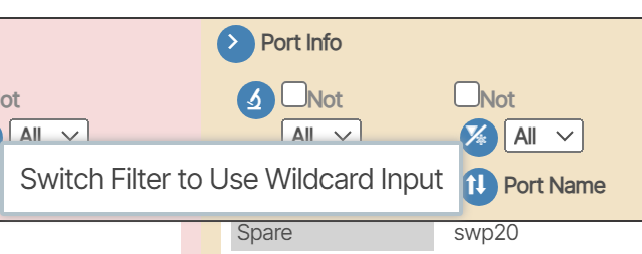
Regular expressions can be selected by clicking on the filter type selection if shown at the top of the column.
Regex format is aligned with Javascript standards and more information can be found here:
Overridden Provisioning🔗
This Report allows you to see all the provisioning changes you have made and confirm or revert them without being on a specific object.
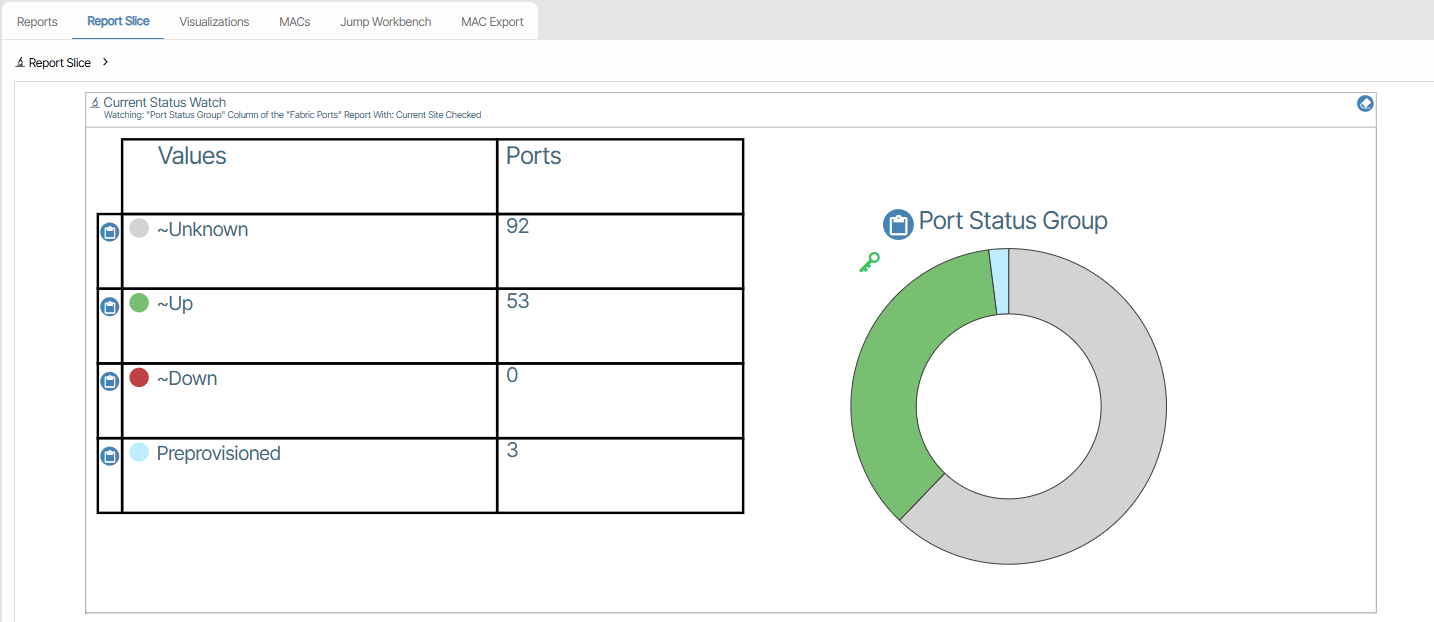
Report Slice Views🔗
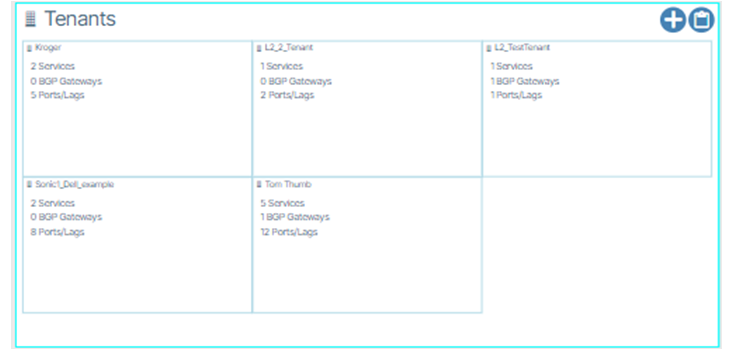
Report Slice View creates a pie graph view of the column in the report. To view the graph click the slice button 
Visualizations🔗
The Visualization feature provides graphical representations of various device details.
Open Visualizations🔗
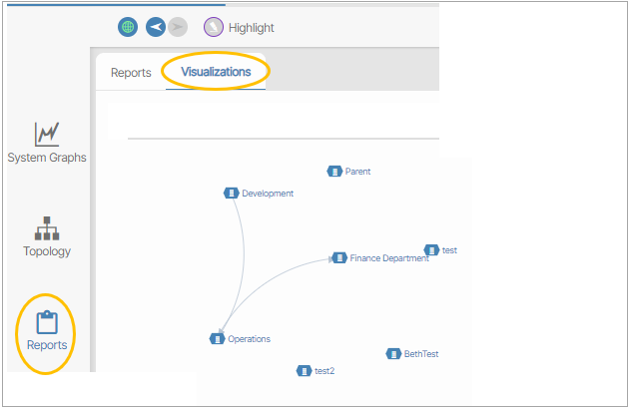
The Visualizations feature can be accessed in three different ways.
- Open Visualizations via the Reports icon and click the Visualizations menu tab.
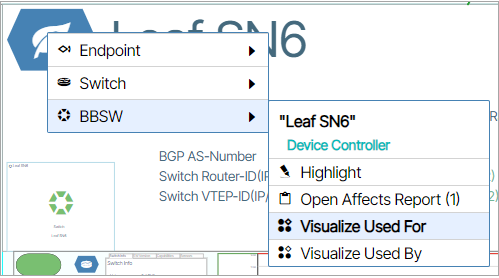
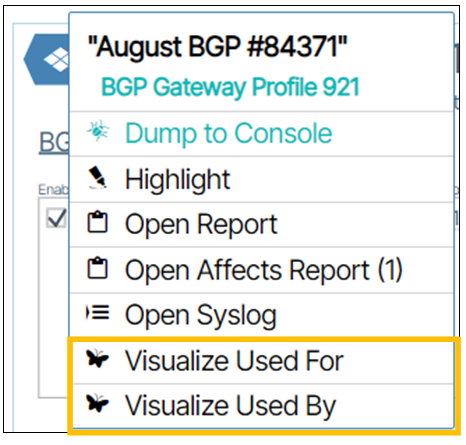
- Right Click a Hex button that provides Visualizations as an option in the form of menus titled Visualization Used For and Visualization Used By.
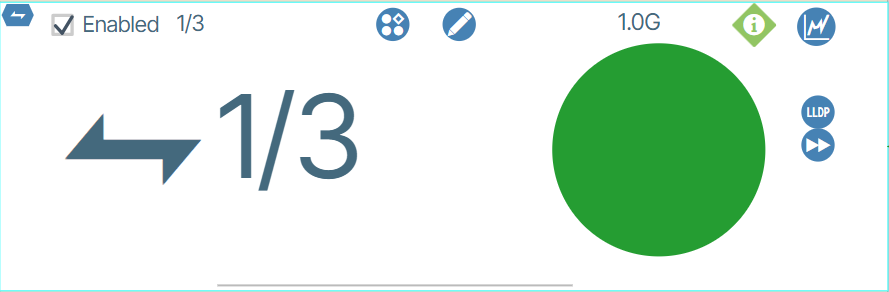
- Click the Visualization icon (
 ) on a device port.
Diagrams🔗
The following sections describe the data representation of each diagram.
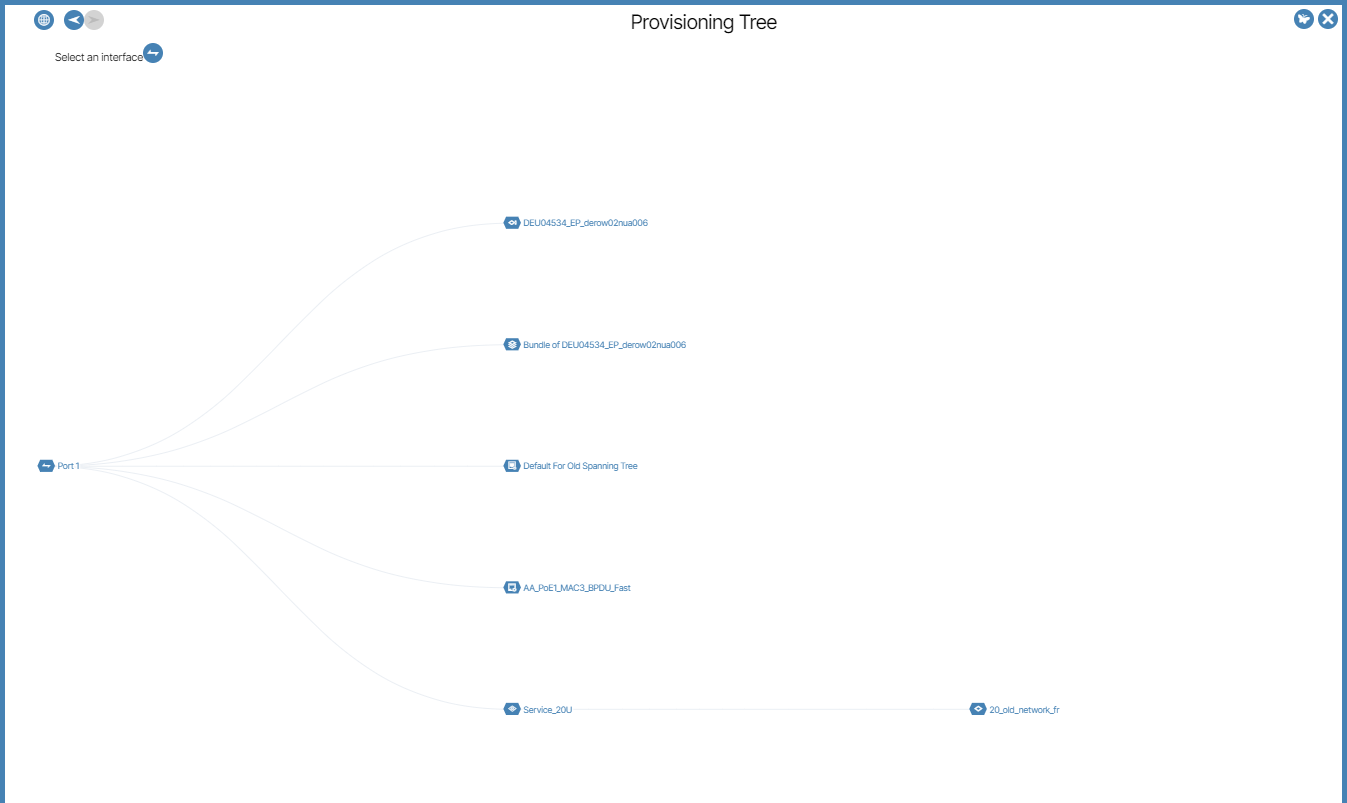
Provisioning Tree🔗
The Provisioning Tree lets you visualize what provisioning objects or interfaces are used for / used by.
There are three ways to access the Provisioning Tree diagram.
- You select Provisioning Tree from the Mini-Map.
- You click the Visualization Button directly on a UI device port.
- You select Visualize Used For or Visualize Used By in the provisioning objects Hex button selection menu.
These three choices are described in detail below.
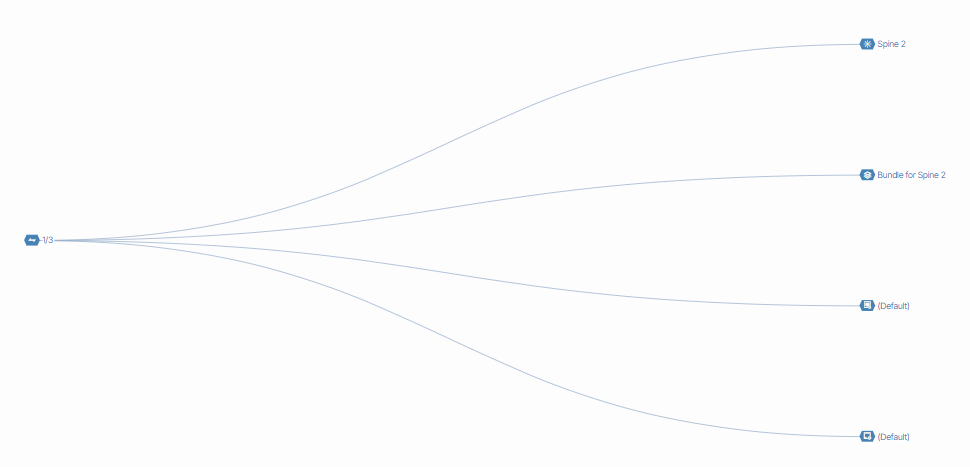
Access Provisioning Tree Visualization from Device Port🔗
Click the ports Open Visualization button ().
The Access Provisioning diagram opens for the selected port.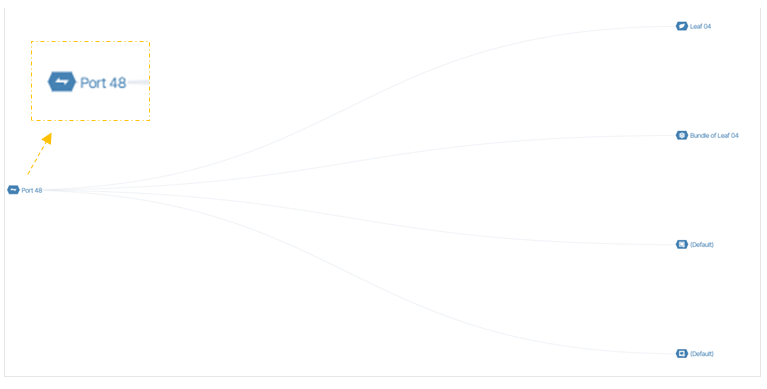
Select Access Provisioning via Visualize Used For or Visualize Used By🔗
When you right-click a provisioning object's Hex button, the menus "Visualize Used For" and "Visualize Used By" are presented to you. These options allow you to view the role of the selected object in relation to other objects.
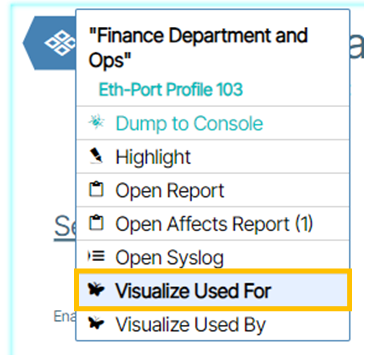
Visualize Used For: This visual representation illustrates the interconnections among objects using the selected provisioning object. The selected provisioning object is on the left, and its hierarchical relationships with the other objects are displayed to the right of it.
In this example Visualize Used For is selected on an Eth-Port-Profile named Finance Department and Ops.
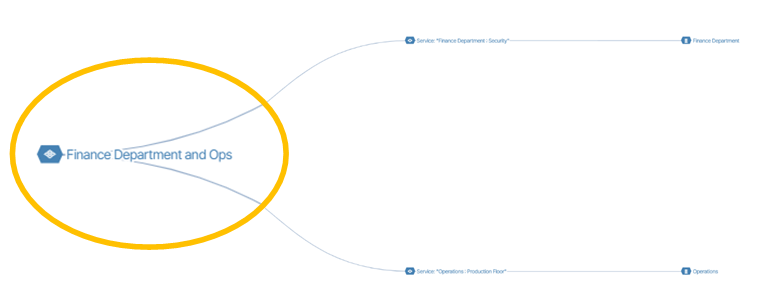
In the diagram below, the object representing the Eth-Port Profile named Finance Department and Ops is rendered to the far left of the diagram and is composed of the objects to the right of it.
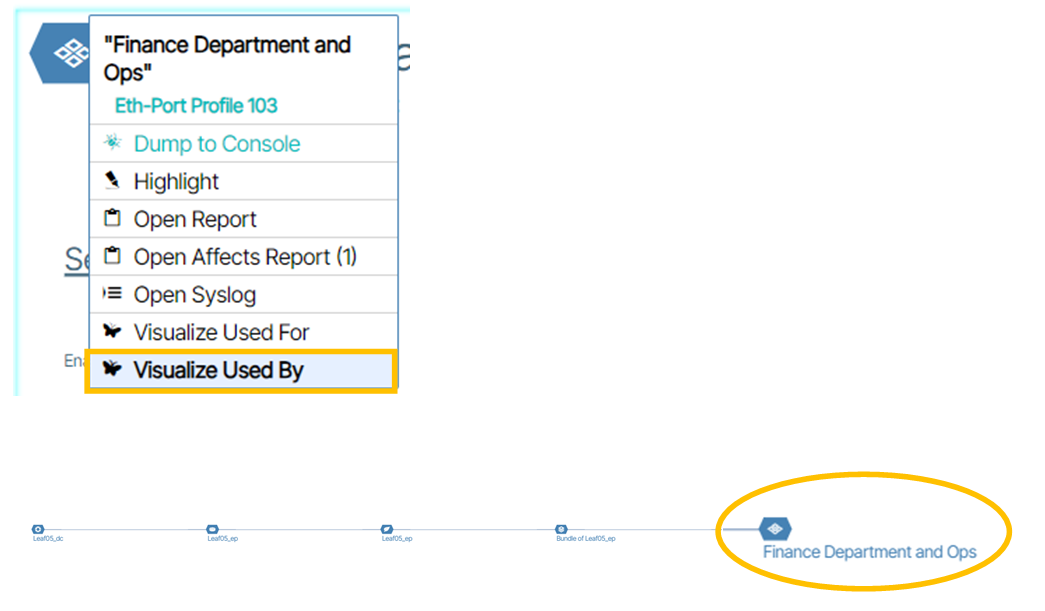
Visualize Used By: This visualization shows objects that are used by the selected object. In this diagram, the selected provisioning object is positioned to the far right, and its hierarchical relationships with objects that use it are presented to the left.
Tenant Route🔗
Tenant Route is a diagram that shows Tenant-Tenant Routing relationships.
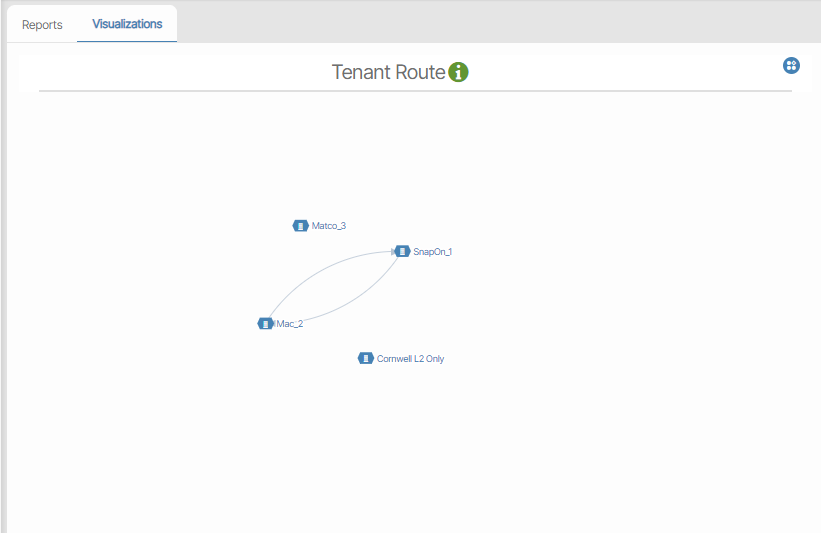
Hovering over an individual Tenant highlights its Tenant-to-Tenant routing relationships in green.
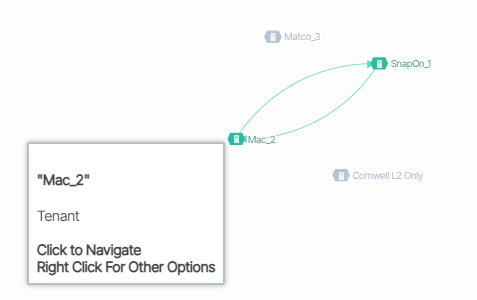
These relationships are reflected in the Tenant Slice window in Tenant-Tenant Routing.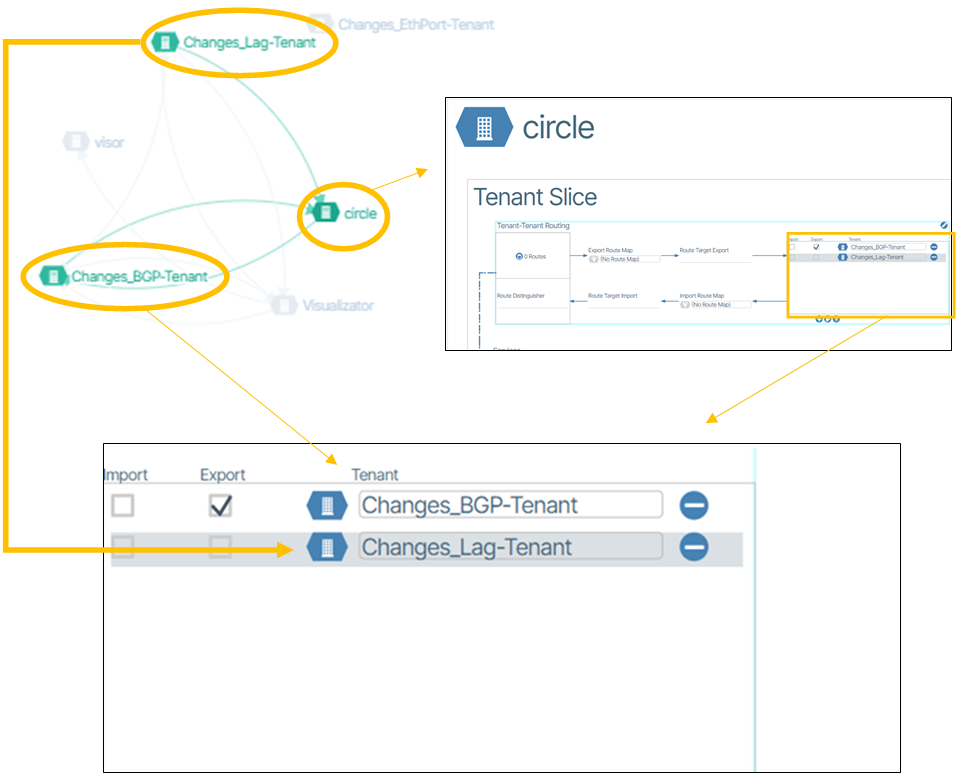
Campus-Specific Monitoring🔗
For campus environments, monitoring focuses on:
- Access port utilization and status - Track user connectivity across buildings
- Building-level network health - Monitor distribution and access layer performance
- PoE usage patterns - Track power consumption for phones, APs, cameras
- 802.1x authentication status - Monitor user authentication success rates
- VLAN and service utilization - Track campus service usage
- Inter-building connectivity - Monitor campus backbone links
- Device inventory and status - Track all campus infrastructure devices
Campus monitoring leverages all the same reporting and visualization capabilities as datacenter deployments, but focuses on campus-specific metrics and use cases.